Grafana
- Get Grafana
- Create Data Source
- SQL Permissions
- Import SQLWATCH Dashboards
- How to bulk add Data Sources
- How to use SQLWATCH dashboards
Grafana dashboards are available since SQLWATCH 3.0. This blog post explains a little bit more about the switch to Grafana.
Get Grafana
Grafana is a free and Open Source dashboarding solution that can be installed in many different ways. I would recommend you head over to Grafana.com to learn about how to install Grafana on your Operating System.
Once installed navigate to your Grafana instance and login with the credentials you have set during the installation. Please read more about the installation on the Grafana.com page as I will not be covering the installation steps in this documentation.
Create Data Source
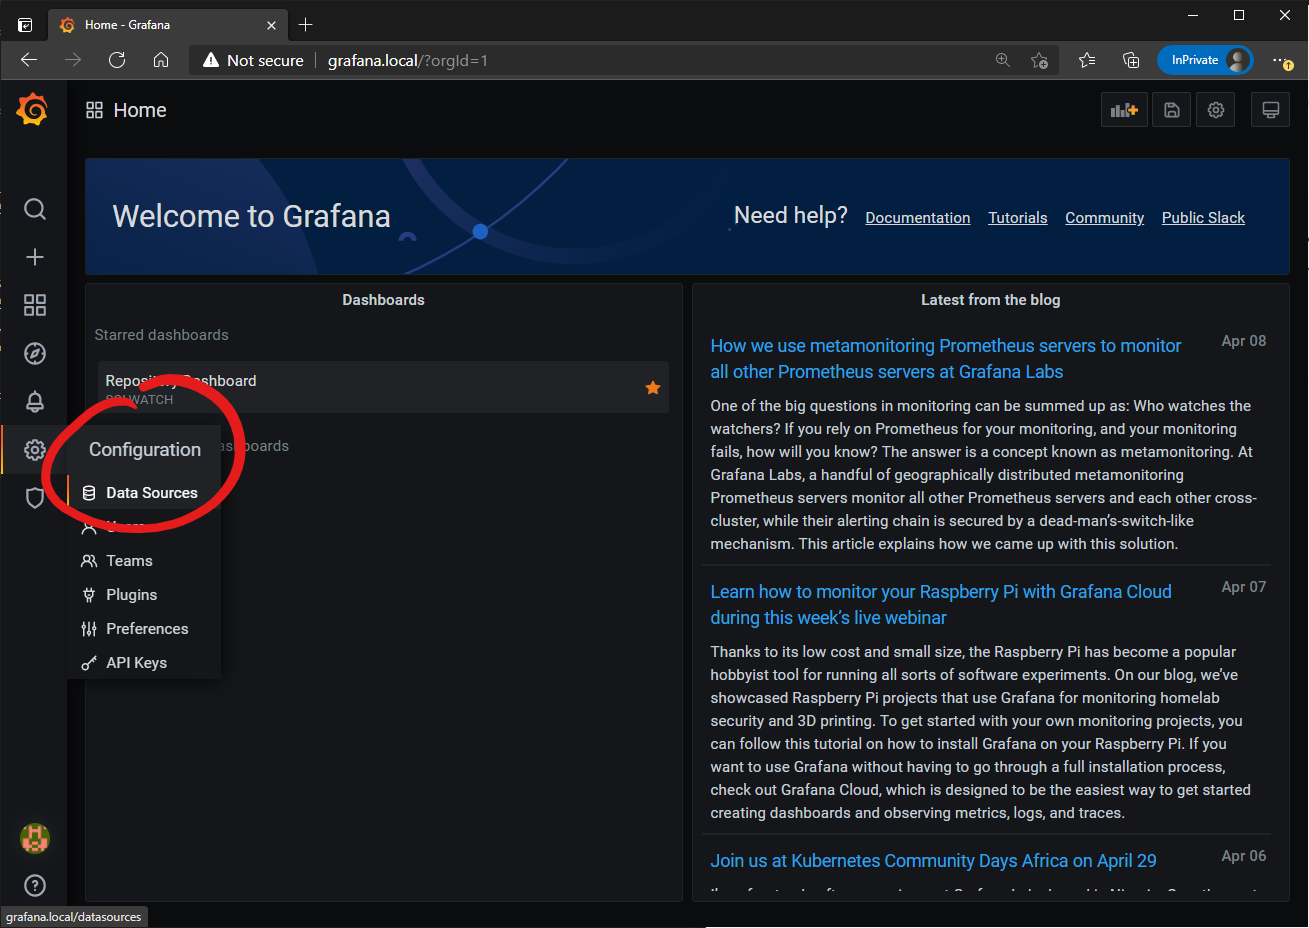
Navigate to Data Sources
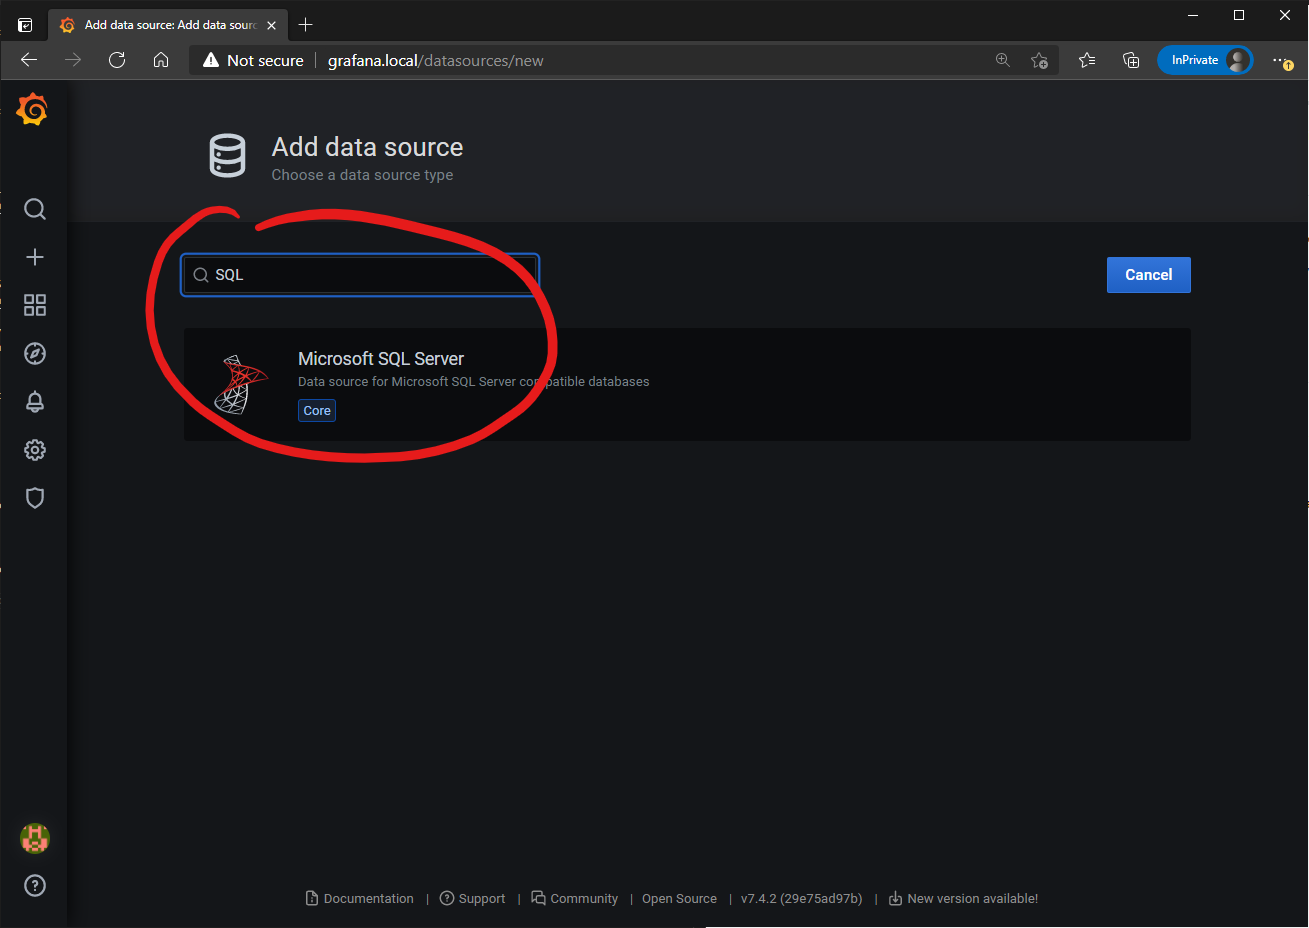
Add new Data Source

Search for Microsoft SQL Server
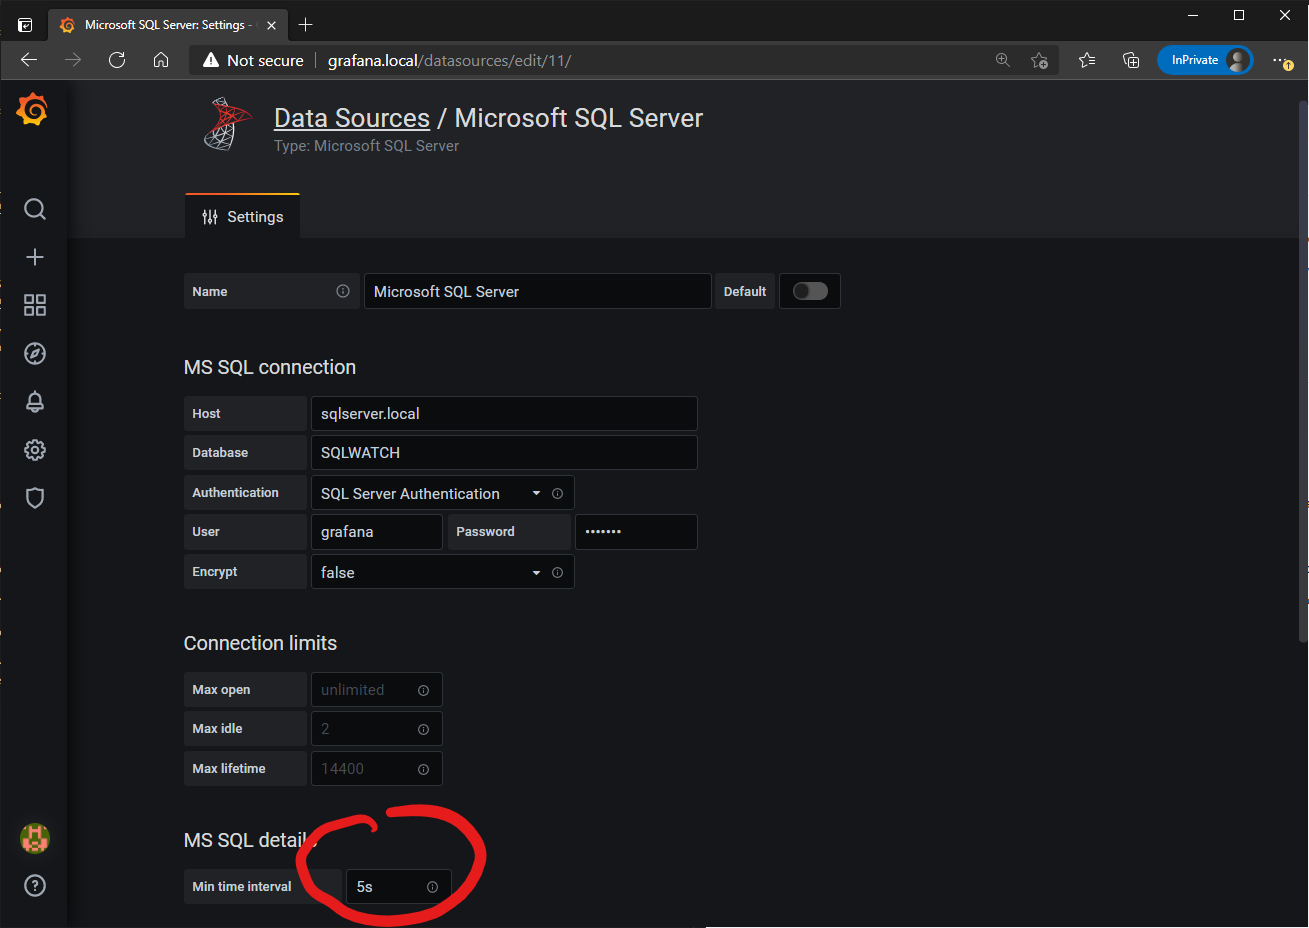
Configure connection to your SQL Server instance. This could be the central repository or any instance hosting SQLWATCH database. Set the minimum time interval to 5 seconds.
SQL Permissions
Grafana user should be a db_datareader on the SQLWATCH database.
Import SQLWATCH Dashboards
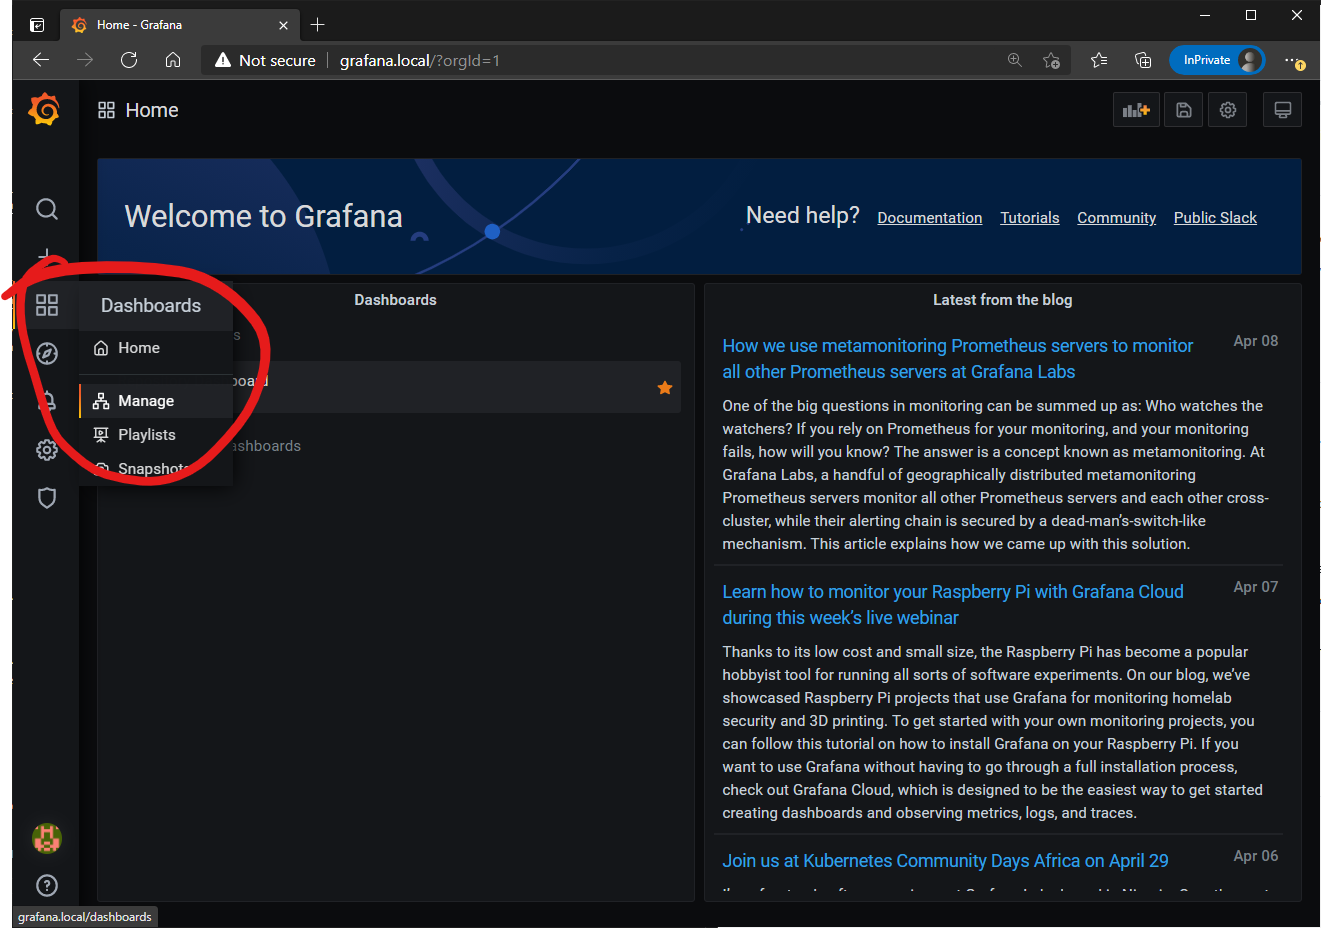
To import SQLWATCH dashboards, navigate to Dashboards -> Manage
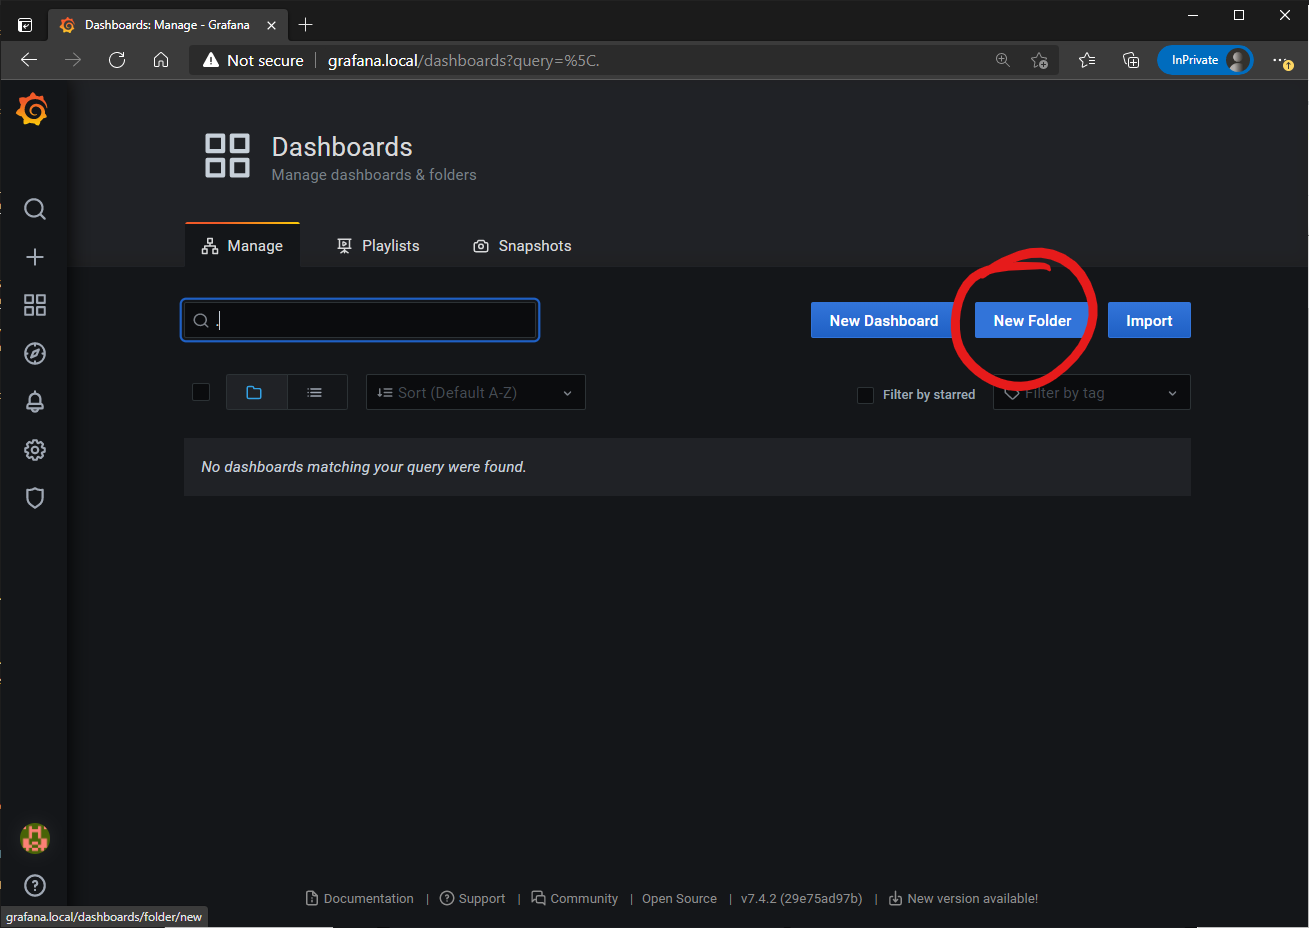
Create new folder called SQLWATCH. This is where all SQLWATCH dashboards will reside.
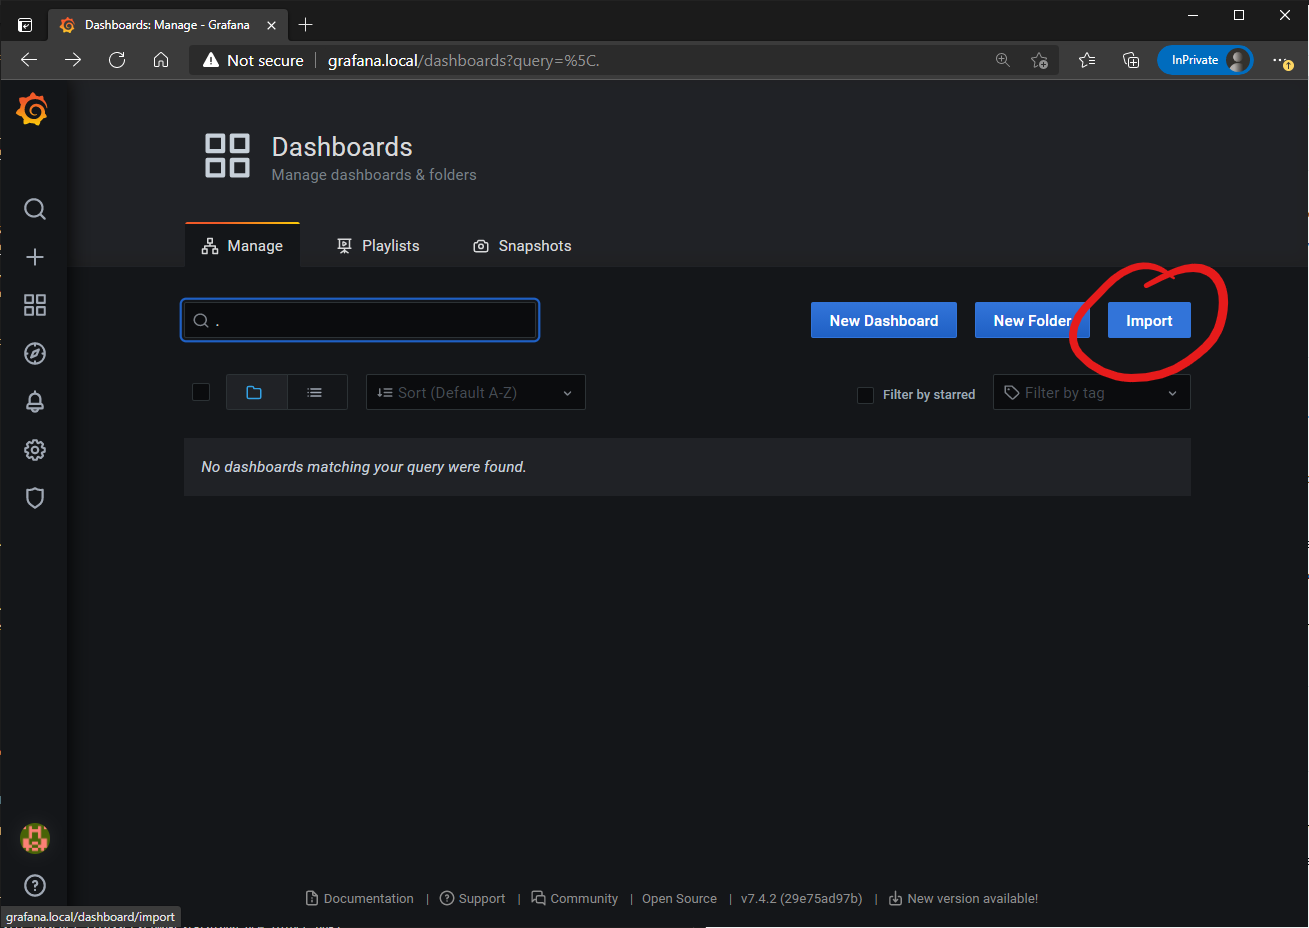
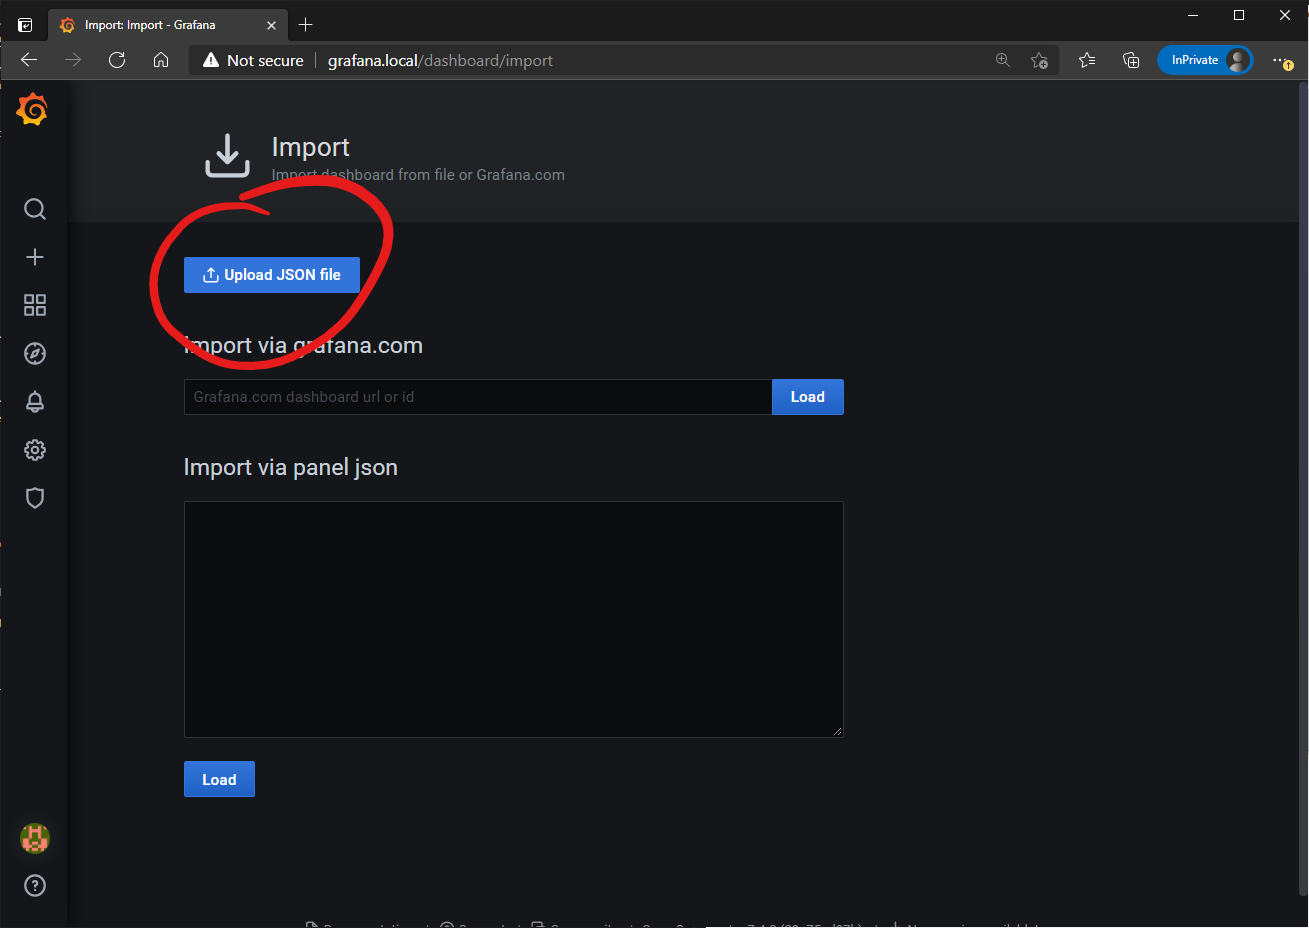
Then click on import and upload JSON file - the SQLWATCH dashboards are JSON files included in the release.
How to bulk add Data Sources
SQLWATCH is decentralised which means it does not require central monitoring server or repository. If you have hundreds or thousands of SQL Servers with SQLWATCH installed, getting all of the remote instances into a single or even multiple central repositories may not be viable. In that case you may want to simply connect Grafana directly to your SQL instances but you will need to create a Data Source for every instance. You can do this programatically using Grafana API:
Generate API key in your Grafana portal at Settings -> Api Keys:
$key = "eyJrIjoiNVJOdDVwdDcwZ2VYUHJYQzkwcldNYjZxd1l1ZlhaZTEiLCJuIjoic3Fsd2F0Y2giLCJpZCI6MX0="
$headers = @{Authorization = "Bearer $key"}
$contentType = "application/json"

$url = "http://grafana.local/api/datasources"

# list data sources:
Invoke-RestMethod -ContentType "$contentType" -Uri $url -Method GET -Headers $headers -UseBasicParsing


# create data sources
# This can be wrapped in a loop and pass SqlInstance, Database and user credentials dynamically
$body = @{
    "name"="SQLInstance";
    "database"="SQLWATCH";
    "type"="mssql";
    "password"="password" ;
    "user"="sqlwatch_grafana";
    "access"="proxy";
    }

Invoke-RestMethod -ContentType "$contentType" -Uri $url -Method POST -Headers $headers -UseBasicParsing -Body ($body|ConvertTo-Json)
How to use SQLWATCH dashboards
Coming soon…