SQLWATCH. Open Source SQL Server Monitoring Framework
- Welcome
- Concept
- Components
- Requirements
- Performance Overhead
- Storage Utilisation
- Large Environments
- About the Project
- Contributing
- Code of Conduct
Welcome
This is the documentation portal for SQLWATCH. We all know how difficult it is to keep documentation up to date and therefore I try to keep minimum information here. Enough to get started but too much so it does not become a burder when some parameters change. If you do not find what you are looking for or if you are having problems, plesae head over to the community corner where we can help you get started.
Concept
SQLWATCH was primarily developed for decentralised Performance Monitoring, ad-hoc Performance Testing and Performance Data Logging in Production Environments for reactive analysis - i.e. to investigate problems after they have occurred. It relies on the SQL Server Agent to invoke local data collection.
Each SQL Server monitors itself and alerts only when it needs attention. Power BI Report can be used to analyse historical performance data. To meet the popular demand for central reporting, an optional centralised reporting repository was recently introduced.
Most enterprise monitoring solutions are centralised which means they often consist of a central repository and monitoring servers, where monitoring servers execute queries against the monitored SQL instance and send the results back to the repository. Whilst this approach has a lot of benefits it also requires a set of dedicated monitoring infrastructure, servers, licensing, and network configuration to allow remote access to the monitored instances which can add complexity and increase the cost. It can also become a single point of failure and a bottleneck. Some solutions also require monitoring agent to be installed locally further increasing complexity. Any network outages between the monitoring server and monitored instance could cause gaps in the collected data.
SQLWATCH has been designed to address some of these challenges, especially in smaller or test environments where dedicated monitoring infrastructure is not feasible. Since we are monitoring SQL Server, we already have one so we can also use it to store the monitoring data.
Automation and integration with dbatools make it easy to keep decentralised deployment in sync and up to date.
Components
SQLWATCH is made of:
- SQLWATCH database
- Dashboards
- Optional Central Repository collector
Requirements
SQLWATCH has been tested with the following SQL Server editions and versions on Windows:
- SQL Server Standard, Enterprise and Express:
- 2008 R2 SP3
- 2012
- 2014
- 2016
- 2017
- 2019
Running SQLWATCH on Linux is also possible with few exceptions: The disk colletor job relies on the Windows WMI interface and there is currently no alternative to collect disk utilisation from Linux. Notifications rely on a PowerShell script which has not been tested on Linux with PS installed.
Data collection is invoked via SQL Server Agent Jobs since the Express Edition does not have Agent Job, the invocation must happen via Windows Task Scheduler or alternative way. SQLWATCH can generate the required commands to Windows Scheduled tasks:
exec [dbo].[usp_sqlwatch_config_set_default_agent_jobs] @print_WTS_command = 1
Additional reading
Performance Overhead
Whilst the decentralised approach can be easier to implement, it introduces additional performance overhead. As we are reading the performance data form SQL Server Dynamic Management Views, we also have to write it on the same instance. SQLWATCH is designed with minimum overhead. It utilises SQL Server Extended Events (XES) where possible and Dynamic Management Views (DMV) collectors that run every minute by default.
SQL Server The Extended Events architecture enables users to collect as much or as little data as is necessary to troubleshoot or identify a performance problem. Extended Events is configurable, and it scales very well.
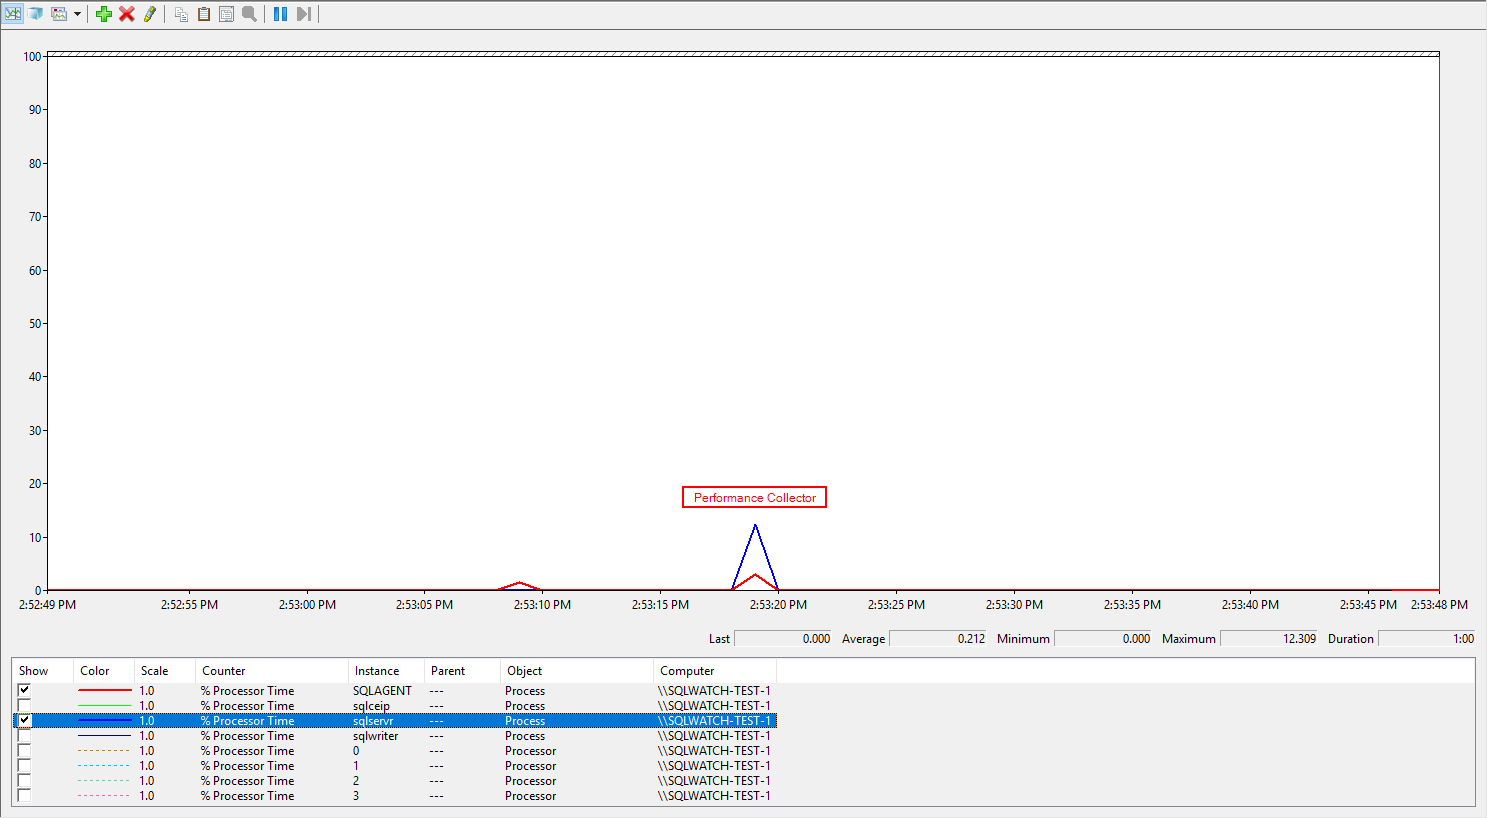
The frequent data collectors such as performance run every minute and take less than a second to execute. There are areas for improvement in the way the XML output from XE sessions is being parsed which will be addressed in the future releases.
The below screenshot shows a 60 seconds window of CPU utilisation of the sqlservr.exe process. The spike is the performance collection which lasts a few milliseconds:
Storage Utilisation
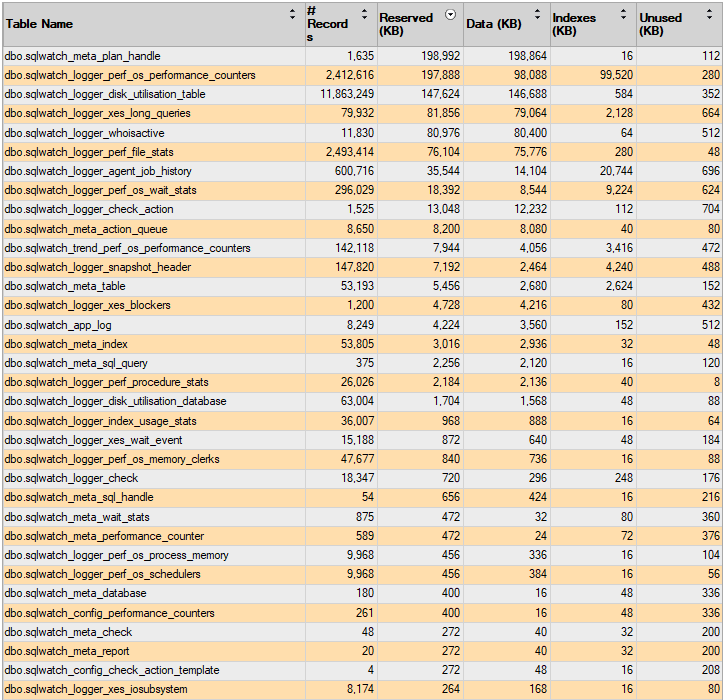
SQLWATCH schema has been designed with long term storage in mind. If possible, it is advisable to enable page compression on SQLWATCH data tables and indexes reducing utilisation by further 25-50%. The amount of space used by SQLWATCH depends on the retention period, the number of databases on the server and the workload. As guidance, below is the size of SQLWATCH in my test environment, with data compression enabled, after 30 days of use:
Appropriate index maintenance must in place in order to make sure table size is not being bloated over time.
Large Environments
There is no limit on how many servers can SQLWATCH monitor. It has been deployed in environments with over 3000 servers and due to its decentralised design, there are no “how many servers can the monitoring server monitor” concerns.
In large environments, it is advisable to create more than one central repository: one or more for Production, one for QA, DEV etc. Instead of putting everything into one bucket, think about how you would like to report and monitor your environment. Perhaps more than one repository for production servers of different regions or cities, applications, use case, departments etc.
In large and busy environments or in environments where space is a concern the following collectors can be disabled to limit the amount of data collected:
- Index Statistics and Histograms
- Long Queries
Furthermore, retention can be decreased to 1 or 2 days, or central repository deployed to offload data from remote instances. Please use the Top Tables report in SQL Server Management Studio to get an idea which tables are growing exponentially.
About the Project
SQLWATCH is being made with ![]() by Marcin Gminski since 2018
by Marcin Gminski since 2018
Contributing
When contributing to this repository, please first discuss the change you wish to make via issue, email, discourse or any other method with the owners of this repository before making a change. Read more about becoming a contributor in our GitHub repo.
THANK YOU TO THE CONTRIBUTORS!
Code of Conduct
SQLWATCH is committed to fostering a welcoming community. View our Code of Conduct on our GitHub repository.