Power BI dashboard
SQLWATCH comes with a Power BI Desktop dashboard to help visualise and analyse collected data. It’s a free Windows application that can be downloaded from their website.
Power BI Desktop release cycle is so frequent that is difficult to target a specific version, please refer to the release notes on GitHub which version to use.
Power BI is very efficient in handling data and displaying visuals. It is also very efficient in data storage making files very small. 90% of Power BI Performance will depend on your local desktop. I have used SQLWATCH dashboard comfortably on a Surface 4 with i7 and 8GB RAM. Hardware requirements
SQLWATCH Dashboard can also run in the Power BI Service. There are no customs requirements for Visuals or any other components. Neither R nor Python is required.
Permissions
No admin permissions are required on the workstation to run Power BI. Database permissions required to ingest data into Power BI are SELECT on views only. db_datareader will be sufficient too.
Getting Started
To set started, simply open the SQLWATCH dashboard (.pbx) in the Power BI Desktop application.
Please note, if you have deployed SQLWATCH using dbatools, the deployment package has been downloaded to the PowerShell temporary directory. This will also include the Power BI template. If you are struggling to find it, you can grab a copy from GitHub
Parameters
Once you have opened the dashboard in Power BI, you are going to have to tell it your server and database names so it can download the data. This is done in parameters: 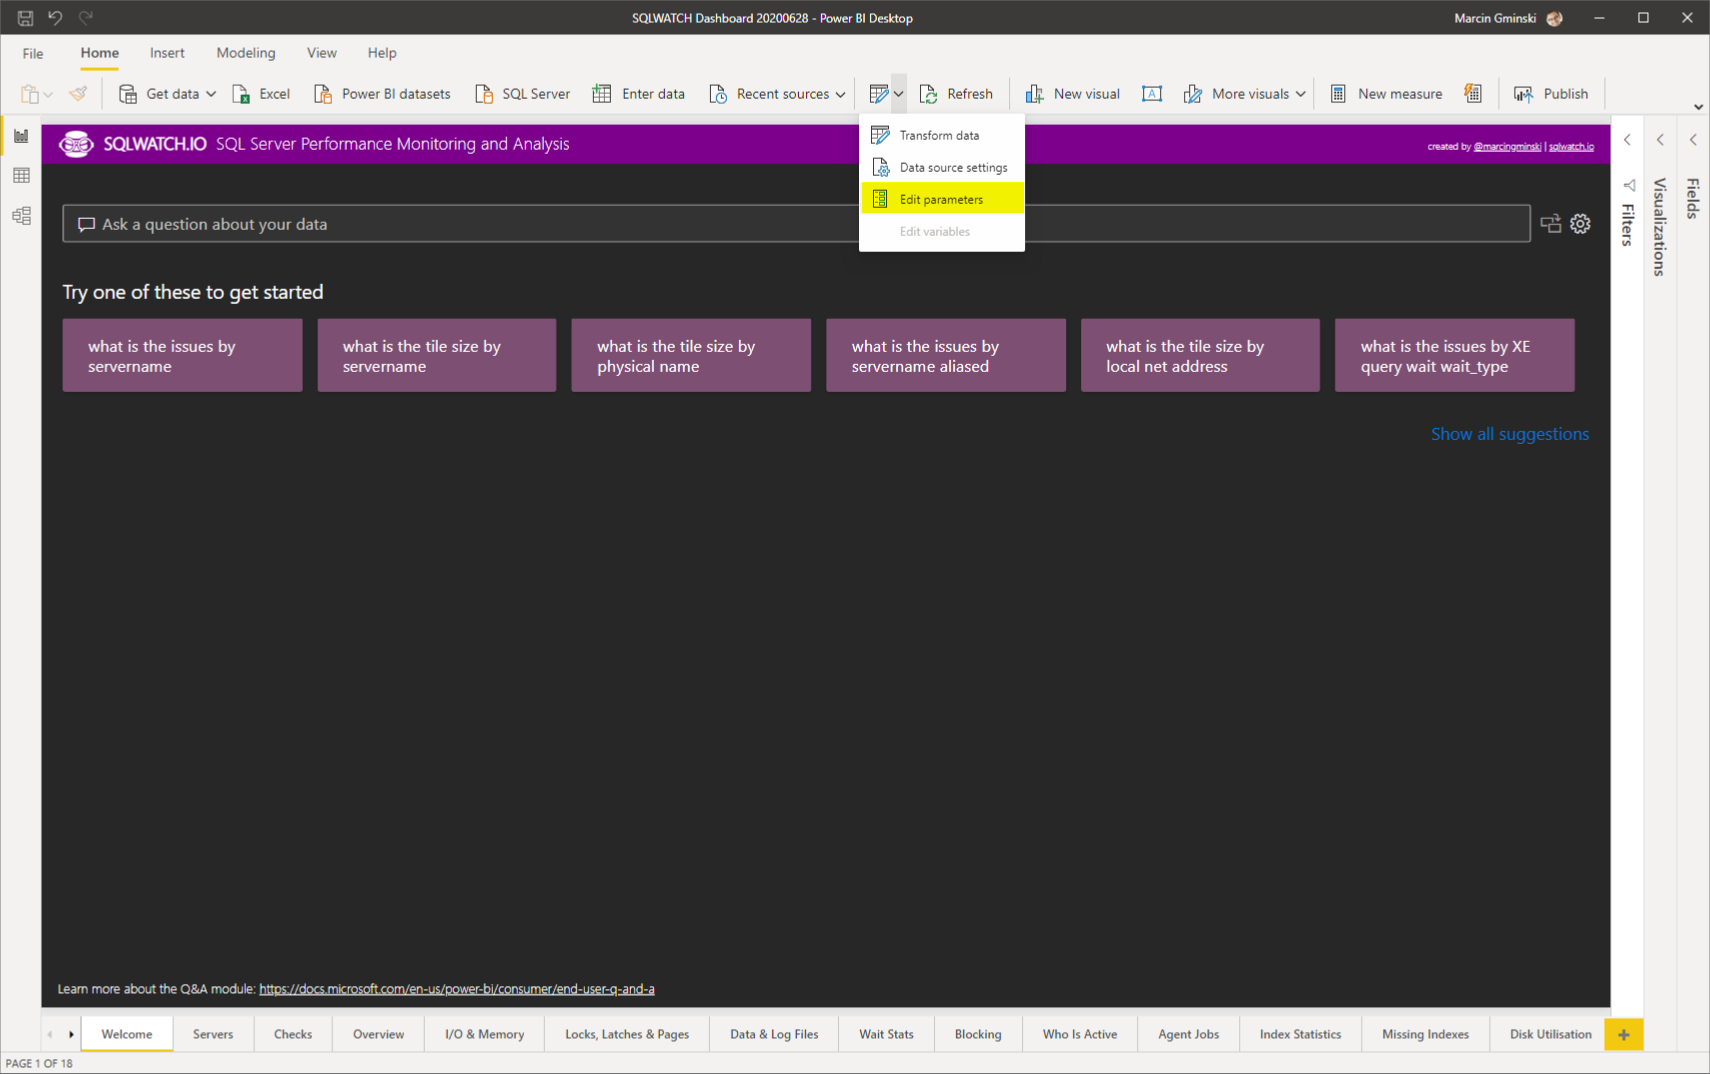
SQL Instance: SQL Instance with SQLWATCH or SQLWATCH Central Repository to connect to
SQLWATCH Database: Name of the databases where SQLWATCH is deployed. By default this is SQLWATCH
Repository Filter SQL Instance: When connected to the repository, all SQL Instances will be shown on the dashboard. Sometimes, however, we want to investigate one specific server in which case, we can limit what is being downloaded to the Dashboard.
Report End Time (datetime): For servers and clients in the same time zone, type date and time when you want reporting window to end. Follow the example in the dropdown box or select NOW to get the most recent, timezone agnostic, data. For example, if you type 2018-12-31 23:59:59, the report will show data up till that timestamp. If your server is in a different time zone than PowerBI, you may need to manually set dates, based on the local server DateTime.
Report Window (hours): How many hours to import going back from the Report end time. For example, if this parameter = 4 and End Time = GETDATE() the report will show the last 4 hours from now. This way you can travel back in time and see any time slice of historical performance data. You can select from the dropdown or type your own.
Note that some collectors run less often than others and some pages may be blank. For example, if the index collector runs every 6 hours at 12am, 6am, 12pm and 6pm and you are loading the dashboard up at 4pm, and only showing last 1 hour, the index statistics will not be shown.
Report Aggregation: Select aggregation over time or type your own. Select DEFAULT to let it automatically calculate the best level based on the report window. For example 5 minute will average data points over 5 minute periods and For large windows i.e. last 30 days you will want to aggregate over a longer period and for shorter windows i.e. 1 hour you will want to investigate at 2-minute intervals. DEFAULT option gives the best performance vs granularity.
Aggregation is a key in performance data analysis. You should always choose the minimum aggregation (i.e. 1 minute) however this will download lots of data from the database. To minimise performance impact, the aggregation will automatically increase with the longer periods and will allow you to view trends over a longer period. Read more about the impact of aggregation on granularity.
Show Baselines: Baselines pull additional data from the SQLWATCH database and, to minimise impact, are only downloaded if the Report Window is <= 24 hours. Also, you can completely disable baselines here.
Privacy
When Power BI loads data it makes sure that data from different sources (or tables) does not get mixed up which, in some systems, could cause privacy issues. Since we are joining different SQLWATCH tables during the load (time dimensions and facts) it may throw a privacy error. To work around this issue, please to go File -> Options and Settings -> Options -> Current File -> Privacy and set Ignore privacy setting: 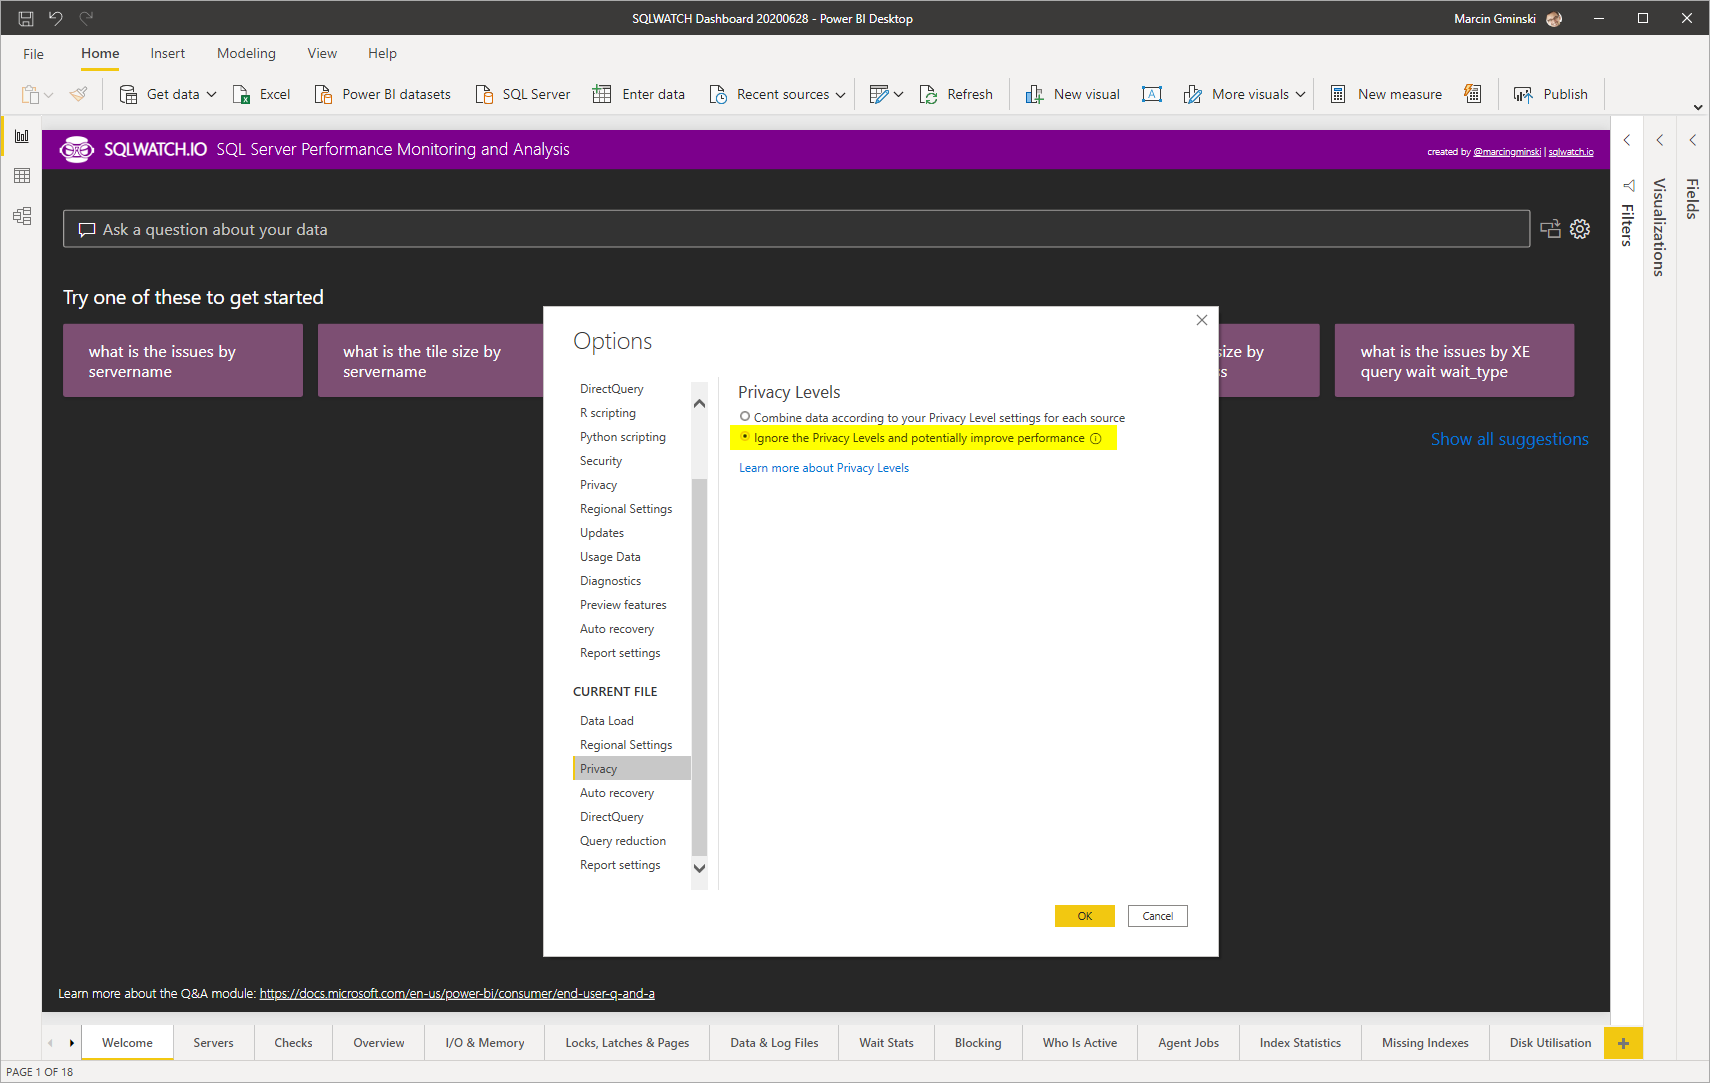
Load Performance
A lot of work has gone into optimisation and reducing the impact on the SQL database when querying data as well as reducing resources required for Power BI to render data. However, there few things to consider when it comes to the Power BI Performance:
Data Volumes This is the most important factor. It is obvious that the more data Power BI downloads, the more it has to process and render. There are some clever mechanisms built into Power BI such as High-Density Sampling which reduce the amount of data rendered with minimised loss of granularity.
However, first and foremost, download less data into Power BI to make it run fast. Reduce the time window or reduce granularity by increasing aggregation. Hiding baselines and filtering central repository will also reduce the amount of data.
Schema parsing and query preparation You will find that there isn’t a lot of activity in the database yet Power BI can still take some time to refresh the data. This is because if it’s cumbersome schema parsing, query preparation and often single threaded execution. There isn’t much we can do about it, it’s just how Power BI works.